Bias Detection in News by Multi Task Learning

Team 3 - Harsh, Abhinav Anand, Sourav Kumar, Aditya Arora

Abstract

Hyperpartisan news is news that takes an extreme left-wing or right-wing standpoint. If one is able to reliably compute this meta information, news articles may be automatically tagged, this way encouraging or discouraging readers to consume the text. It is an important use case as most news and tweets these days are biased.

Harsh
Hyperpartisan articles mimic the form of regular news articles, but are one-sided in the sense that opposing views are either ignored or fiercely attacked.

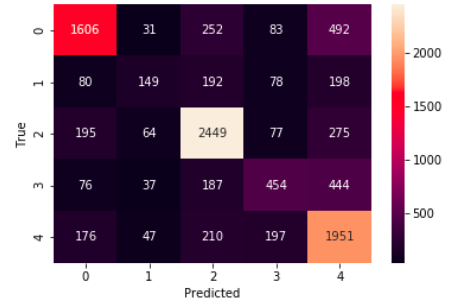
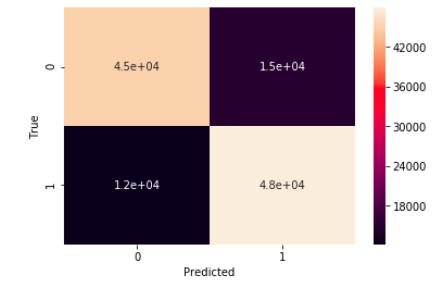
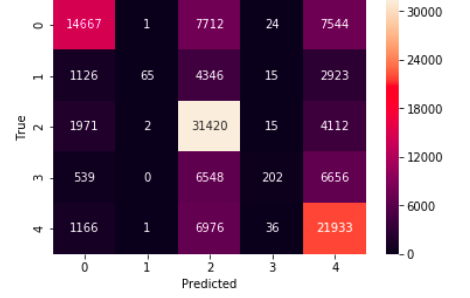
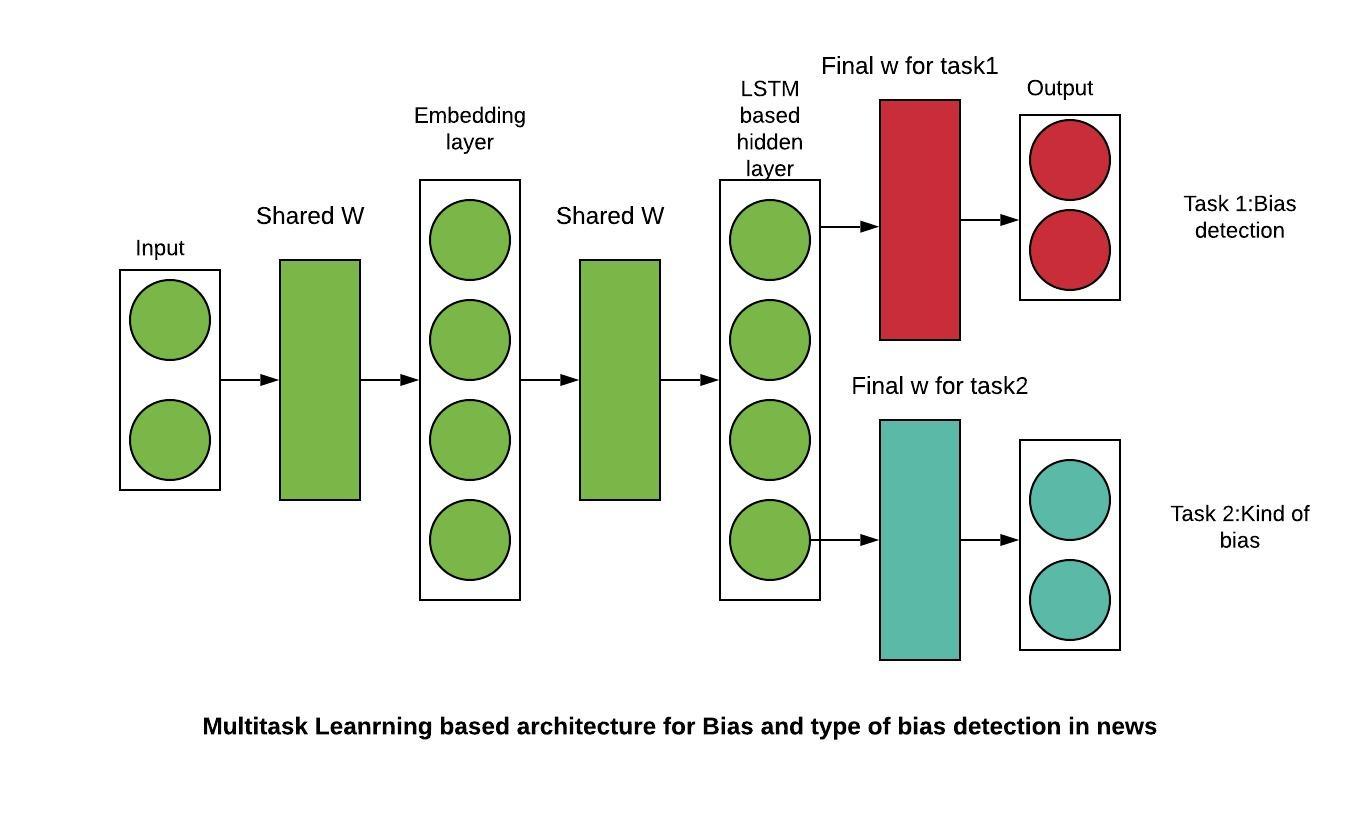
Problem Statement - Given the text and markup of an online news article, decide whether the article is hyperpartisan or not. The challenge of this task is to unveil the mimicking and to detect the hyperpartisan language, which may be distinguishable from regular news at the levels of style, syntax, semantics, and pragmatics. If an article is biased we also try to predict the type of bias in the article. The types of bias we are considering are- Right, Right-Center, Least, Left-Center, Left

Harsh

Dataset

Link to dataset : SemEval 2019 Task 4: Hyperpartisan News Detection
The data is split into multiple files.

  • Files with names starting with "articles-" contains the articles, which validate against the XML schema article.xsd.
  • Files with names starting with "ground-truth-" contains ground-truth information, which validate against the XML schema ground-truth.xsd.
Data is divided into two parts:
  1. First part of data -
    • Contains filename "bypublisher" and is labeled by the overall bias of the publisher.
    • Contains total of 750,000 articles
    • Half of total (375,000) are hyperpartisan and half are not.
    • Half of the articles that are hyperpartisan (187,500) are on the left side of the political spectrum, half are on the right side.
    • This data is split into a training set (80%, 600,000 articles) and a validation set (20%, 150,000 articles).
  2. Second part of data
    • Contains filename "byarticle" and is labeled through crowdsourcing on an article basis.
    • Data contains only articles for which a consensus among the crowdsourcing workers existed.
    • It contains a total of 645 articles
    • 37% (238) are hyperpartisan and 63% (407) are not.

Baseline

  1. Logistic Regression
  2. We first used tf-idf vectorizer for feature extraction. Tfidfvectorizer first converts the text into frequency matrix. This is followed by converting this count matrix into normalized tf-idf matrix. The goal of using tf-idf instead of the raw frequencies of occurrence of a token in a given document is to scale down the impact of tokens that occur very frequently in a given corpus and that are hence empirically less informative than features that occur in a small fraction of the training corpus. After this we applied logistic regression for classification. The results using this model are shown below.

    Results

    1. Hyper partisanship
      • Precision, Recall and F1 Score
        Precision Recall F1-Score
        Biased 0.77 0.79 0.78
        Unbiased 0.78 0.76 0.77
      • Accuracy
        Accuracy on validation set = 78%
      • Confusion Matrix
        Harsh
    2. Kind of bias
      • Precision, Recall and F1 Score
        Precision Recall F1-Score
        Right 0.74 0.80 0.77
        Right-Center 0.58 0.76 0.66
        Least 0.51 0.38 0.44
        Left-Center 0.75 0.65 0.70
        Left 0.45 0.21 0.29
      • Accuracy
        Accuracy on validation set = 66%
      • Confusion Matrix
        Harsh

  3. Naive Bayes
  4. Again in case of naive bayes we used tf-idf vectorizer for feature extraction. We then used Naive Bayes classifier for multinomial models. Naive Bayes method is suitable for classification with discrete features(such as tf-idf/word count in this case). The results using this model are shown below.

    Results

    1. Hyper partisanship
      • Precision, Recall and F1 Score
        Precision Recall F1-Score
        Biased 0.76 0.80 0.78
        Unbiased 0.79 0.75 0.77
      • Accuracy
        Accuracy on validation set = 78%
      • Confusion Matrix
        Harsh
    2. Kind of bias
      • Precision, Recall and F1 Score
        Precision Recall F1-Score
        Right 0.75 0.49 0.59
        Right-Center 0.94 0.01 0.02
        Least 0.55 0.84 0.66
        Left-Center 0.69 0.01 0.03
        Left 0.51 0.73 0.60
      • Accuracy
        Accuracy on validation set = 57%
      • Confusion Matrix
        Harsh

Final Architecture

  1. Neural Network(without Multitask learning)
  2. We used word2vec representation as we are using word embeddings. We then used LSTM for training the multinomial classifier models. To handle the correlation/dependence between input variables we are using Neural Networks over traditional Naive Bayes.
    Harsh

    Results

    1. Hyper partisanship
      • Precision, Recall and F1 Score
        Precision Recall F1-Score
        Biased 0.91 0.95 0.93
        Unbiased 0.94 0.91 0.93
      • Accuracy
        Accuracy on validation set = 93%
    2. Kind of bias
      • Precision, Recall and F1 Score
        Precision Recall F1-Score
        Right 0.98 0.96 0.97
        Right-Center 0.84 0.86 0.85
        Least 0.81 0.82 0.81
        Left-Center 0.89 0.91 0.90
        Left 0.89 0.76 0.82
      • Accuracy
        Accuracy on validation set = 89%

  3. Neural Network with Multitask Learning
  4. For the final evaluation we implemented Multi Task learning. Multi-Task learning is a subfield of Machine Learning that aims to solve multiple different tasks at the same time, by taking advantage of the similarities between different tasks. This can improve the learning efficiency and also act as a regularizer which we will discuss in a while. In this project we had 2 tasks - determining if a news article is biased and determining the type of bias. Now these 2 tasks are not entirely disjoint and 1 task can help in the learning process of the other.
    We begin by converting all text samples in our dataset into sequences of word indices. A word index is simply an integer identifier for that word. We only consider the top 50000 most commonly occurring words in the dataset as part of our vocabulary. We also limit the maximum size of each sequence to 1500 words.
    We used word embeddings from pre-trained Glove. It was trained on a dataset of one billion tokens (words) with a vocabulary of 400 thousand words. The glove has embedding vector sizes: 50, 100, 200 and 300 dimensions. We chose the 300-dimensional one.We kept the trainable parameter as False to see if the model improves while keeping the word embeddings fixed. Next we create a weight matrix which is nothing but a set of glove vectors for every word in our word index. Then we load this embedding matrix into an Embedding layer. The Embedding layer maps the integer inputs to the vectors found at the corresponding index in the weight matrix. Finally we build our multitask LSTM model to solve the classification problem.
    Harsh
    The above diagram shows the model we are using. In this we have an input layer which feeds the data to the model. The dataset contains XML file which is cleaned up and prepared such that each word is one-hot encoded. The size of vector space in our model is 300 dimensions. This is done by the embedding layer. The next layer in LSTM based hidden layer. The output layer is different for both the tasks. Initially the model had no regularization and as a result was overfitting the training data. Because of this it gave very low accuracy on validation set. So we added a dropout of 0.5 in each layer. FInally we get weight matrices from the output layer using which we can classify a news as biased or unbiased and the second weight matrix which can be used to determine the type of bias in the article.

    Results

    1. Hyper partisanship
      • Precision, Recall and F1 Score
        Precision Recall F1-Score
        Biased 0.91 0.95 0.93
        Unbiased 0.94 0.91 0.93
      • Accuracy
        Accuracy on validation set = 93%
    2. Kind of bias
      • Precision, Recall and F1 Score
        Precision Recall F1-Score
        Right 0.98 0.96 0.97
        Right-Center 0.84 0.86 0.85
        Least 0.81 0.82 0.81
        Left-Center 0.89 0.91 0.90
        Left 0.89 0.76 0.82
      • Accuracy
        Accuracy on validation set = 89%

Demonstration